
Climate monitoring and intelligence for critical operations

Every extreme event starts as a dot on the map
01020304
0102030405
Same model, different sectors

Anticipate risks. Protect operations.

From data to alert, from alert to action: the operation stops before the event, not after.

Five of the eleven sectors where FieldPRO is already in the field.

Risk score

Weather already sets the pace of your operation. FieldPRO turns every reading into anticipation, so the decision comes before the event, not after.

The forecast that knows your terrain.

Conventional models deliver the average of an area 10 to 100 km across. Our devices measure right on the asset and correct the forecast with every new reading: the error stops growing over time.

020301
How the forecast corrects itself.
Measure

The devices on the asset read rain, wind, temperature and humidity every few minutes, on the ground where the operation happens.

From the regional average to the meter of your asset.
‹›

Rain accumulated over 6 h · summer storm. Illustrative area, drag the divider to compare.

Conventional forecast · 10 to 100 kmFieldPRO forecast · fine grid, corrected on the asset

A storm smaller than the block is diluted in the average and shows up weak, or not at all. On FieldPRO’s grid it shows up where it falls, at the intensity it has.

Summer storm

An intense, highly localized late-afternoon storm: 38 mm in about six hours. The conventional forecast sees 31 mm and leaves 7 mm out. With the devices in the field, 37.2 mm — 98% of what actually fell.

Accumulated rain forecast for 48 h, with and without the devices in the field, against what actually fell. Drag over the chart to compare hour by hour.

STORM010203040012243648RAIN, MMFORECAST HORIZON, HMEASURED ON THE ASSET38.0 mmFIELDPRO FORECAST37.2 mm · 98%CONVENTIONAL FORECAST31.0 mm · 82%
+18 h · 18h
Forecast horizon+18 h18h
Measured on the asset26.8 mmReference
FieldPRO forecast26.3 mmDeviation −0.5 mm
Conventional forecast18.3 mmDeviation −8.5 mm

Three operations, R$ 380 million avoided a year.

Losses avoided per year, calculated with each client from the recorded events.

Total avoided per yearR$ 0 M
01 / 03 · Rumo
See the operation ↻
Railway · Rumo
RailwayRumo
R$ 100 MAvoided per year
343alerts
14,000 kmof track
18 monthsin operation

We monitor the critical slopes along 14,000 km of network. Rain accumulated over 96 h is crossed with soil saturation, the geometry of each slope and the stretch’s landslide history. When the risk crosses the threshold, the operation gets the alert with the exact km and the window to act: slow down or stop the train before the event.

Accumulated rain 96 hSoil saturationSlope geometryLandslide history

See the operation ↻
Forestry · Suzano
ForestrySuzano
R$ 200 MAvoided per year
286critical days
12 monthsin operation

We follow the microclimate of the planting and management areas. Water deficit, temperature and humidity are read together with the planting calendar, and the team knows which days are critical for each stand. That way it adjusts planting, irrigation and work crews before losing seedlings to water stress.

Water deficitTemperatureHumidityPlanting calendar
See the operation ↻
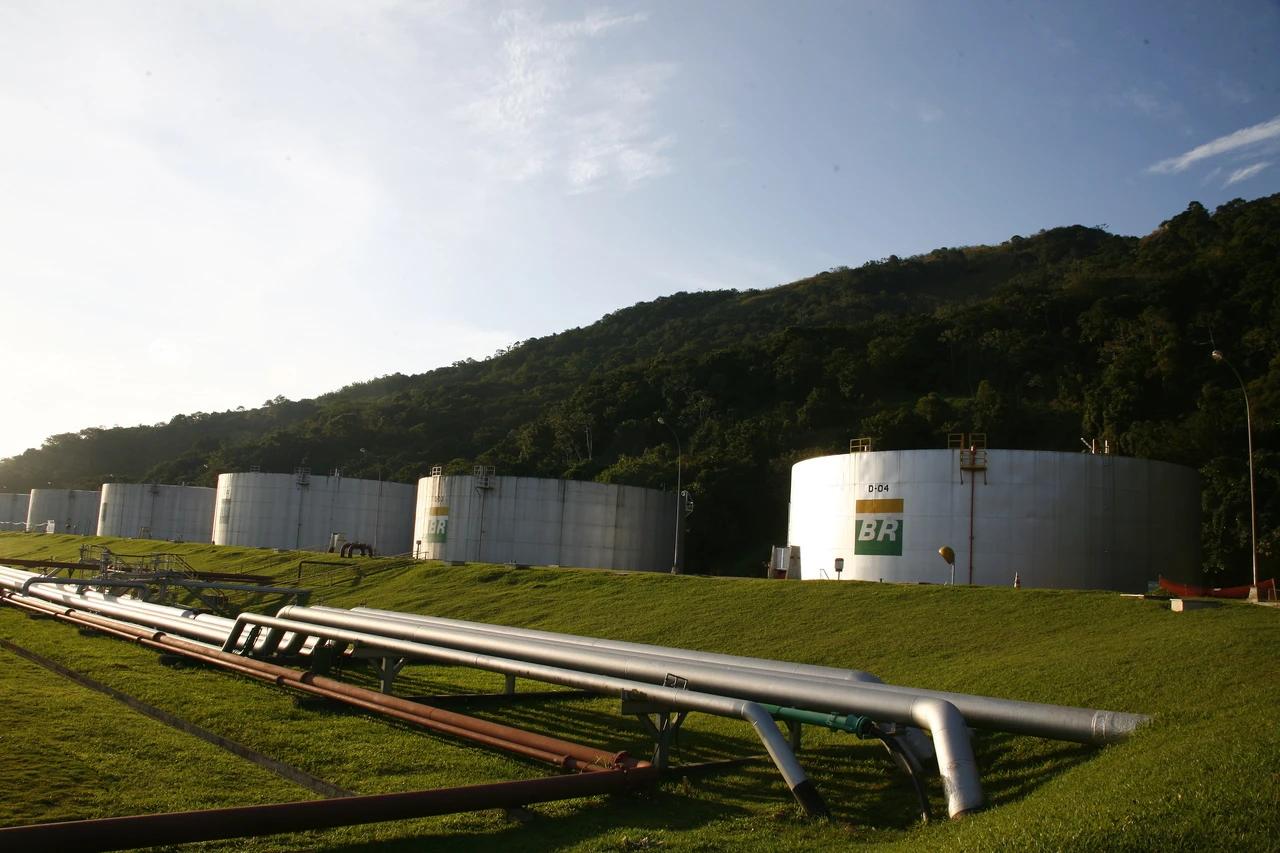
Pipelines · Transpetro
PipelinesTranspetro
R$ 80 MAvoided per year
5critical events
12 monthsin operation

We cover pipeline corridors on hillsides and in sensitive areas. Extreme rain is crossed with soil saturation and the environmental sensitivity around them, to prioritize the stretches where a mass movement could hit the pipeline. Preventive inspection goes where the risk is real.

Extreme rainSoil saturationEnvironmental sensitivity

Where FieldPRO is already in the field.

Each district is a sector. Click, drag or browse the list to see what FieldPRO does in each one.

Drag to explore
Overview

Select a sector on the map, or drag to explore.

11Sectors
16Clients
Try the platform